Sunday, November 12. 2006
The exponential in $R^d$

In question 15 I want to make a picture how looks like for
. I want to take at least two-dimensional vectors, as the inner product is too trivial otherwise. But then
is a function on
, which is rather difficult to plot. So I want to fix
and plot
, which is then a function on
with values in
and therefore easy to plot. As the inner product is
, it is in the 2-dimensional case a simple plane-equation
; of course, the inner product is linear and goes through the origin! It cuts the zero-plane
in an angle which is dependent on the orientation of the fixed
: The zero-line evolves where the vectors
are orthogonal to the fixed
, i.e.,
.
This zero-line will now change its angle on the zero-plane while varying the fixed vector . This gives a picture how it behaves as a whole. In Octave, I set
[xx yy]=meshgrid(linspace(-2,2,50));
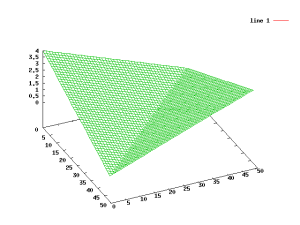
and then made a plot corresponding to by
mesh(xx+yy)
The resulting 3D-plot shows a boring inclined plane. To better see the location and orientation of the zero-line, I plot the absolute values:
mesh(abs(xx+yy))
To see the orientation even better, I chose
imagesc(abs(xx+yy))
imagesc(abs(xx+2*yy))
imagesc(abs(-xx+4*yy))
corresponding to the further vectors and
. This is what I get:


The turning around of that plane now corresponds to the behavior of the mentioned inner product function on . (Beware that the absolute values used in the plots hide the asymmetry of the inner product function!) The values are always real and go into the exponent of the exponential function.
then “rotates fastest” as
runs along to a fixed
, and is constant = 1 if it runs orthogonally; Beware that there’s a difference whether it is constant = 1 or if it reaches that value again and again. So, in the integral of the FT, the exponential function simply covers all frequencies via exhausting all values of
, and the FT is then a function in
, which takes out a single orientation of those frequencies; As already mentioned some time ago, the term “frequency” isn’t useful anymore in higher dimensions. For two-dimensional signals, i.e. images, a “frequency” can be interpreted as a pattern of lines: The narrower the pattern, the higher the frequency is. The difference to one-dimensional signals is, that those frequencies may now have an angle. It is not enough to just look at a single frequency of that line-pattern, but also to all their orientations! Only with using all orientations of patterns, an image can be analyzed according to the contained frequencies. The 2D-FT of an image therefore tells you what patterns occur in what orientation. To be more precise, you select the frequency by the length
and the orientation by its angle
, because the inner product as a function in
grows faster with growing length of
. For me, this is now a milestone in understanding the 2D-FT.